Flips,

Sunsets,

And lots of water fun

Most of the set is at
http://www.flickr.com/photos/cullenfluffyjennings/sets/72157624879404358
Random fluffy thoughts, and emergency phone calls
Flips,
Sunsets,
And lots of water fun
Most of the set is at
http://www.flickr.com/photos/cullenfluffyjennings/sets/72157624879404358
I put together a 1-wire temperature sensor with a Arduino board with Ethernet Shield. Every 5 minutes, it posts the current temperature to Pachube.com. Since there is only outbound connections, it works with firewalls and NATs with not port forwarding. It also has DHCP as I find hard coding IP addresses sort of a pain. I used a DS18S20 temperature sensor.
You can find the software at: http://fluffyhome.googlecode.com/svn/trunk/arduino/PachubeClientWithDHCP.cpp
First you will need to install the DHCP library from: http://blog.jordanterrell.com/post/Arduino-DHCP-Library-Version-03.aspx
And then install the 1-wire library and Dallas Temperature Control library which are both found inside the the zip file at: http://milesburton.com/wiki/index.php?title=Dallas_Temperature_Control_Library#Download
At this point you need to have an account on Pachube and create a manual update feed. The first data stream will be used for the temperature. Next you need to go in to the PachubeClientWithDHCP.cpp file and edit the API KEY and feed ID to match yours. You don’t really need to change anything else. If you have other Arduino with fake MAC addresses, you might want to check this one does not conflict.
The 1-wire bus is connected to Digital IO pin 8 on the Arduino and pulled high to the 5v power with a 4K ohm resistor. Pin 1 of the DS18S20 is connected to ground, pin 2 to the 1-wire bus, and pin 3 to 5v power. (Yah, I know about parasitic power but I have power so I used it).
Compile and install the software, connect up the Ethernet, and start it. That’s about it.
Useful LInks:
http://www.pachube.com
http://milesburton.com/wiki/index.php?title=Dallas_Temperature_Control_Library#Download
http://arduino.cc/en/Main/ArduinoEthernetShield
http://arduino.cc/
http://www.maxim-ic.com/quick_view2.cfm/qv_pk/2815
http://fluffyhome.googlecode.com/svn/trunk/arduino/PachubeClientWithDHCP.cpp
http://blog.jordanterrell.com/post/Arduino-DHCP-Library-Version-03.aspx
Google charts (see http://code.google.com/apis/chart/ ) is infinitely better than MRTG but still, uh, still pretty bad.
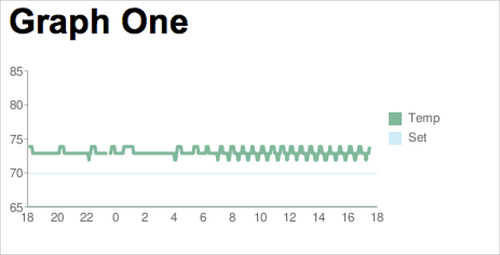
I wrote a python program that you can find at http://fluffyhome.googlecode.com/svn/trunk/indigo/graphVars.py that goes through the Indigo database (you can see my preivios posts for how temperature data gets into this database), looks for all the changes to the mainTemp variable, and creates an HTML web page that calls googles charts to produce a graph.
An example graph is
Let me start by just ranting about how bad MRTG is. It is unquestionable the worst graphing program I have ever used. No auto scale, can’t to negative numbers, can’t have a y axis that does not start at zero, need I say more. Oh, yah, obtuse and confusing to use.
I’m using a venstar T1900 thermostat (http://venstar.com) along with insteon module from SmartLabs (http://www.smartlabsinc.com) over to a INSTEON controller connected to the Indigo software from http://www.perceptiveautomation.com.The first step is to get the temperature from the thermostat into the database on the system running the Indigo software. I do that with using a “Time/Date Action” in the Indigo software that runs ever 10 minutes and has an action type of “Execute AppleScript”. I use the following embedded script
All the code following in this blog post is license under the simplified BSD license (see http://www.opensource.org/licenses/bsd-license.php) if you want to use it.
set myThermostatName to “MainThermo” # you can find the name to put here in the Device screen in Indigo
tell application “IndigoServer”
set mainThermoDev to device myThermostatName
set myTemp to temperatures of mainThermoDev
set value of variable “mainTemp” to myTemp
set myHumidity to humidities of mainThermoDev
set value of variable “mainHumidity” to myHumidity
end tell
This causes the variables to be updated with the values from the thermostat. Any time they change, they get written to the database.
Next I have a shell script program that reads values out of the databases and puts them in weird format that MRTG wants. This script looks like
#!/bin/csh
setenv VAL ` sqlite3 -csv /Library/Application\ Support/Perceptive\ Automation/Indigo\ 4/IndigoSqlClient/sqlite_db ” SELECT var_value FROM variable_history WHERE var_name=’$1’ ORDER BY ts DESC LIMIT 1 ; ” `
if ( $VAL == false ) then
echo 0
else if ( $VAL == true ) then
echo 100
else
echo $VAL
endif
echo 0
echo 0
echo $1
exit 0
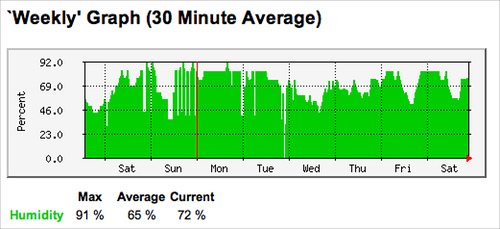
I call this script from the MRTG. My MRTG configuration has an entry that looks like
Target[mHumidity]: `/Library/WebServer/mrtg/scripts/mrtgGetVar.sh mainHumidity`
Options[mHumidity]: nopercent,growright,nobanner,integer,gauge,noo
Title[mHumidity]: Main Humidity
PageTop[mHumidity]: <h1>Main Humidity</h1>
YLegend[mHumidity]: Percent
ShortLegend[mHumidity]: %
LegendI[mHumidity]: Humidity
LegendO[mHumidity]: Humidity Index
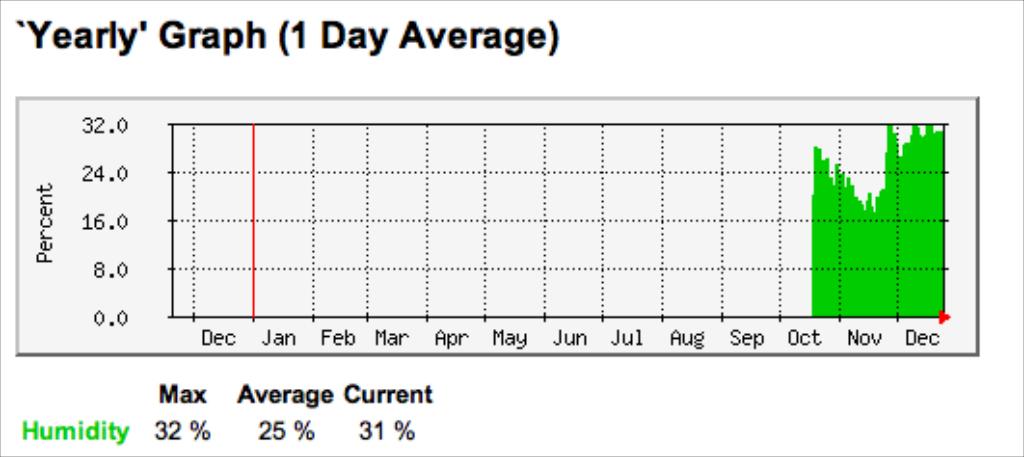
MaxBytes[mHumidity]: 100
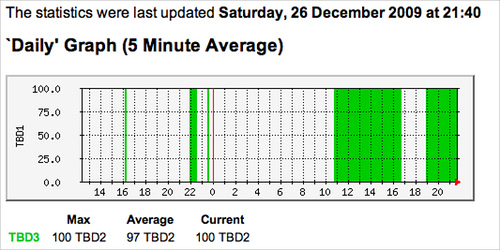
And the end result is a graph like
I also have some triggers that happen when my office ligth goes on or off and set a variable called COfficeLight to true or false. The MRTG config looks like:
Target[cOffLight]: `/Library/WebServer/mrtg/scripts/mrtgGetVar.sh COfficeLights`
Options[cOffLight]: nopercent,growright,nobanner,integer,gauge,noo
Title[cOffLight]: C Office Lights
PageTop[cOffLight]: <h1>C Office Lights</h1>
YLegend[cOffLight]: TBD1
ShortLegend[cOffLight]: TBD2
LegendI[cOffLight]: TBD3
LegendO[cOffLight]: TBD4
MaxBytes[cOffLight]: 110
Produces a graph like
Finally I have a python program to get weather information. This program requires the wether API for python to be installed (see http://code.google.com/p/python-weather-api/ ). The python program looks like
#!/usr/bin/env python
import pywapi
import string
import optparse
import sys
def main():
global options
optionParser = optparse.OptionParser(version=”%prog 0.1”,
description=”Get weather in format approperate for MRTG”,
usage=”%prog [options] city”)
optionParser.add_option(‘—verbose’,’-v’,action=’store_true’)
optionParser.add_option(‘—metric’,’-m’,
action=’store_true’,
help=”use metric values. Default is imperial”)
optionParser.add_option(‘—humidity’,”,
action=’store_true’,
help=”Return relative humidity instead of temperature.”)
options, arguments = optionParser.parse_args()
if ( len(arguments) != 1 ):
optionParser.error(“Must provide one city name such as ‘Calgary,AB’ “)
if options.verbose:
print “City is ” + arguments[0]
result = pywapi.get_weather_from_google( arguments[0] )
if options.humidity:
humRes = result[‘current_conditions’][‘humidity’]
hum = “%s”%humRes
if options.verbose:
print “Raw humidity string is ” + hum
h = int( float( hum.lstrip(“Humidity: “).rstrip(“%”) ) )
if options.verbose:
print “Parsed humidity is %d”%h
print “%d”%h
print 0
print 0
print “OutsideHumidity”
else:
if options.metric:
print result[‘current_conditions’][‘temp_c’]
print 0
print 0
print “OutsideTempCelcius”
else:
print result[‘current_conditions’][‘temp_f’]
print 0
print 0
print “OutsideTempFahrenheit”
return 0
if __name__ == “__main__”:
sys.exit(main())
and I use a MRTG config like:
Target[outsideHumidity]: `/Library/WebServer/mrtg/scripts/mrtgGetWeather.py —humidity “Calgary,AB” `
Options[outsideHumidity]: nopercent,growright,nobanner,integer,gauge,noo
Title[outsideHumidity]: Outside Humidity
PageTop[outsideHumidity]: <h1>Outside Humidity</h1>
YLegend[outsideHumidity]: Percent
ShortLegend[outsideHumidity]: %
LegendI[outsideHumidity]: Humidity
LegendO[outsideHumidity]: Humidity Index
MaxBytes[outsideHumidity]: 100
To get a graph like
I wanted to publish some sensor data from my house up to pachube.
I used a venstar T1900 thermostat (http://venstar.com) along with insteon module from SmartLabs (http://www.smartlabsinc.com) over to a INSTEON controller connected to the Indigo software from http://www.perceptiveautomation.com.
First you need to create an account on pachube.com and create a new feed with two data streams. The first stream is temperature and second is humidity. Make sure the “Feed Type” is set to manual when you created the feed. From the pachube site, you need to get your API key and the feed ID for the feed you created. In the Indigo software, I created a “Time/Date Action” that runs ever 10 minutes and has an action type of “Execute AppleScript”. I use the following embedded script
The following code is license under the simplified BSD license (see http://www.opensource.org/licenses/bsd-license.php) if you want to use it.
# to use this script, you need to edit the next three lines with your API key, and URL for for your feed, and device name in indigo software for your thermostat
set myPachubeAPIKey to “PUT YOUR KEY HERE”
set myPachubeFeed to “http://www.pachube.com/api/feeds/1234.csv” # change to your key
set myThermostatName to “MainThermo” # you can find the name to put here in the Device screen in Indigo
tell application “IndigoServer”
set mainThermoDev to device myThermostatName
set myTemp to temperatures of mainThermoDev
set value of variable “mainTemp” to myTemp
set myHumidity to humidities of mainThermoDev
set value of variable “mainHumidity” to myHumidity
end tell
try
set myRes to do shell script “curl –max-time 10 –silent –show-error –request PUT –header ‘X-PachubeApiKey:” & myPachubeAPIKey & “‘ –data ‘” & myTemp & “,” & myHumidity & “‘ ” & myPachubeFeed
if myRes is not equal to ” “ then
log “Problem with posting to pachube. curl result is:” & myRes
end if
on error
log “Error execting curl to post to pachube.com: Result was ” & myRes
end try
#log “ran the temp log script temp=” & myTemp & ” humidity=” & myHumidity
You can get a google gadget on a web page to graph your feed by embedding the following code after changing the feedID from 1234 to whatever your feed is.
<script src=”http://www.gmodules.com/ig/ifr?url=http://apps.pachube.com/google_gadget/p.xml&up_feedID=1234&synd=open&w=400&h=300&title=House+Temp&border=http%3A%2F%2Fwww.gmodules.com%2Fig%2Fimages%2F&output=js”></script>
The end result should look something like:
| House Temp | ||||
| ||||
I have had the pleasure of coming to the Netherlands multiple times in the past few years and I have always had a really great time. Part of that fun has been the warm friendly people but it is also their social tolerant approach to legislation that allows people to make their own choices about what is safe for them. Lots of things are legal in the Netherlands that just aren’t legal where I live. I really liked this and decided to participate in one of the activities that’s not legal where I live to get a real feel about the safety implications and how I felt about them.
Note in all the following photos, no one is ever wearing any protection on their head. There is a huge demographic range and none of them use head protection.
There are men and women,


And ones where I’m not sure

Thin and Not so Thin


There are old people


There are young people

There black, white, other, and multicolor


But nobody seems to care about the usual drivel about not wearing headphones


Not to mention the use of mobile phones


Or perhaps a little texting while riding

Some idiot with a Canon 5D taking a photo of himself while riding. No doubt not a local.

PS – Corda, thanks for embarrassing me into finally updating my blog. I will try and post some family photos some time.
It certainly possible that David Iredale, a lost hiker, would be alive today if we actually bothered to deploy wireless location systems.
Lost teen’s emergency calls prove futile – Yahoo! News
Of course, you can dial 911 and also die in the cold. A similar story from roughly the far side of the world.
There has been plenty of coverage of the death of Elijah Luck in Calgary. The short version is that when the family dialed 911, but the address that Comwave who provided the VoIP phone service had on file was out of date as the family had moved. Comwave had an updated billing address but did not have an updated address for the location of the phone. Emergency response could not be routed in to Elijah in an acceptable time and Elijah later died.
Sure sucks that updating where to send the bill was a higher priority than keeping people alive.
Probe of tragedy raises further questions – The Globe and Mail
Canada’s 9-1-1 emergency – The Globe and Mail
Regulator blames Net phone provider in fatal 911 mix-up – The Globe and Mail
Internet phone company sounds 911 alarm – The Globe and Mail
911 tragedy in Calgary reveals perils of VoIP – The Globe and Mail
 VS
VS 
 VS
VS 
 VS
VS 
 VS
VS 

Read more about it at http://gov.ca.gov/index.php?/press-release/3910/
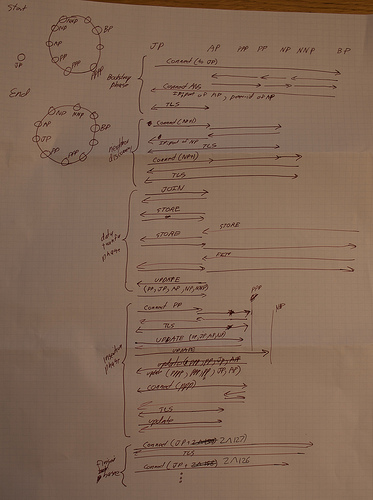
Draft call flow for the palgebra p2p sip stack.
My friend Duane who is clearly the best Vancouver Blogger is involved in some sort of strange scam to improve his google score. I am shocked, simply shocked that anyone participates in trying to to manipulated googles rating by posting links to other peoples blog on their blog. You can read more about it at http://duanestorey.com/2008/01/29/vancouver-blogger/. PS – If you are not convinced yet to go read this, Duane has great photos, check out his Blog of Vancouver Taboo Sex Show.

So as a good IETF guy, how could one not love “The Standard”.